Q2 2022
NYC Real Estate Development Overview / H1 2022
Development Site Advisors® is pleased to present a H1 2022 NYC Real Estate Development Overview. By meticulously researching through ACRIS and DOB job filings, we have compiled sales and development data from January through June 2022. Total Dollar Volume, Average Sales Price, Total Buildable SF and Average Price per Zoning Floor Area unsurprisingly all increased from H1 2021 to H1 2022. Brooklyn led the boroughs in Number of Sales, Total Dollar Volume, and Total Buildable SF. Sales in Manhattan saw 300% increase approximately on Dollar Volume and Total Traded Buildable SF.
Development Transactions
129
Number of Sales
-2% vs Q2 2021
$1.48B
Total Dollar Volume
57% vs Q2 2021
8.04M
Total Buildable SF
36% vs Q2 2021
Highlighted New Buildings
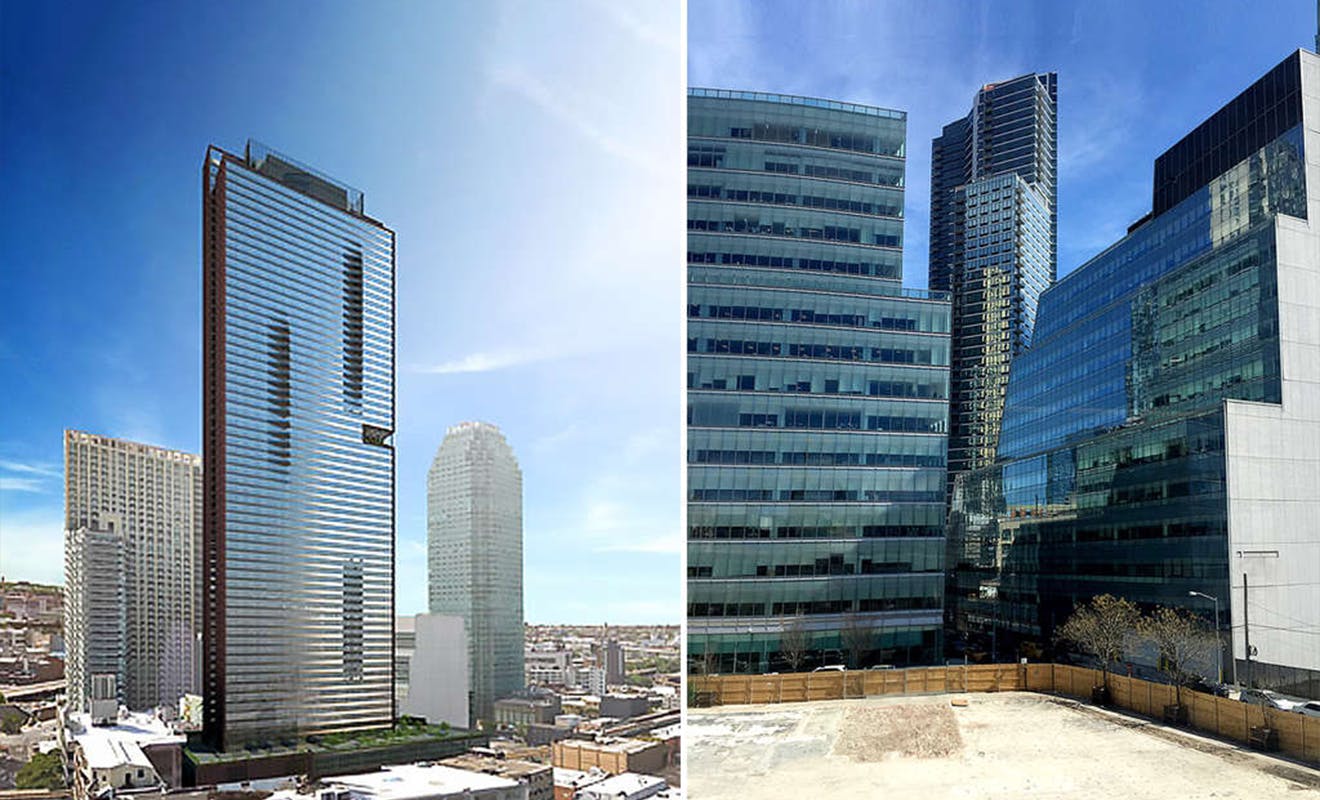
43-16 & 43-30 24th St Portfolio
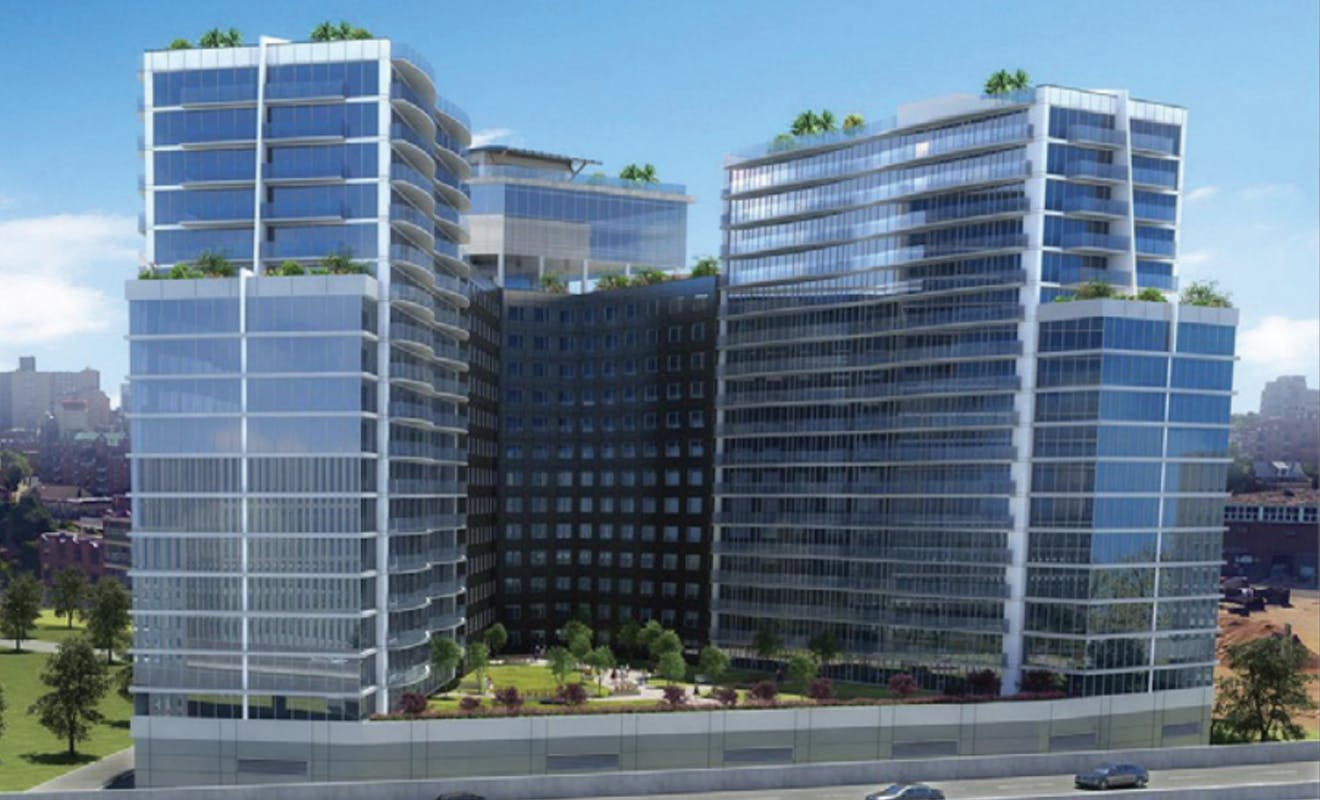
131-01 39th Avenue
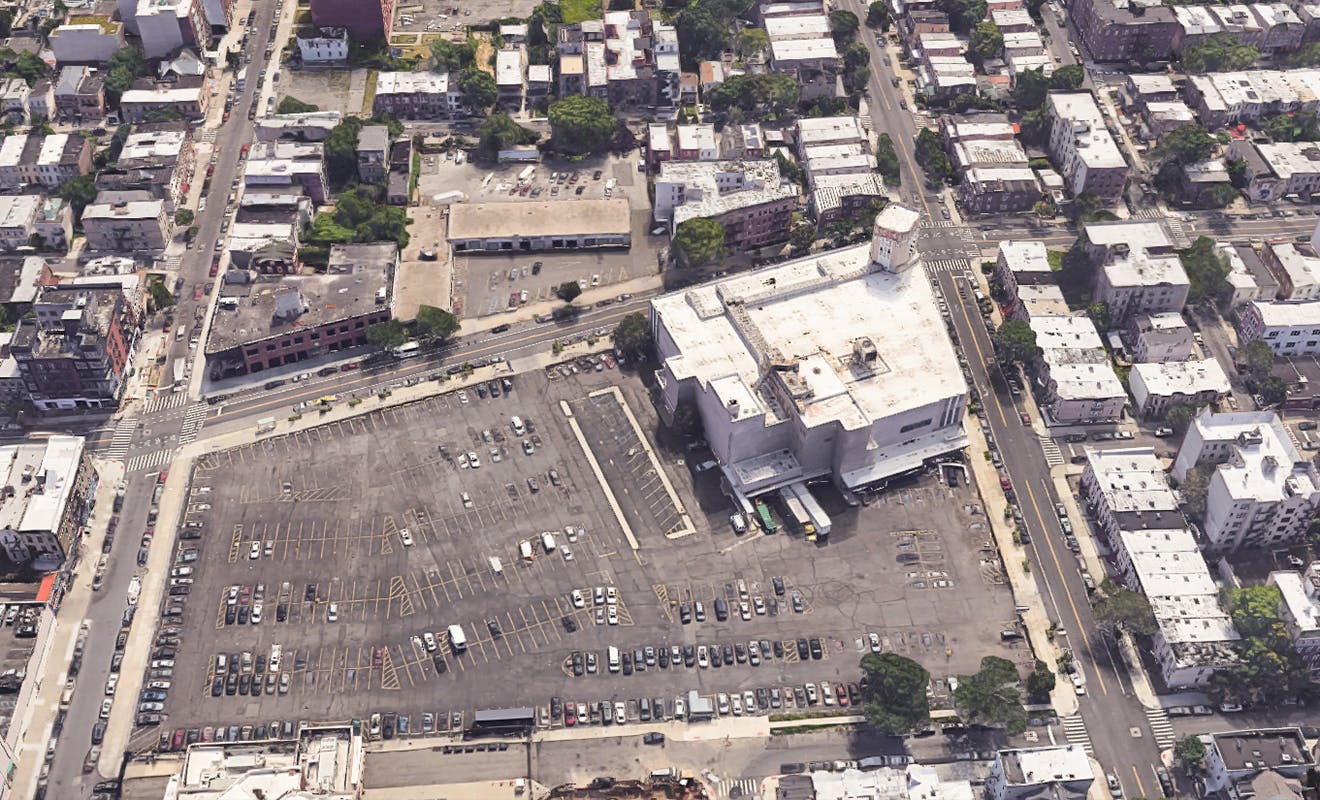
2359-2360 Bedford Ave Portfolio