Q1/2023
NYC Real Estate Development Overview / Mid- Year 2023
Development Site Advisors®️ is pleased to present an H1 2023 NYC Real Estate Development Overview. By meticulously researching through ACRIS and DOB job filings, we have compiled sales and development data from January through June 2023. The Number of Sales, Total Dollar Volume, and Total Sold Buildable SF decreased in comparison to H1 2022. Meanwhile, the citywide Average Sales Price and Average price per ZFA slightly increased, especially in comparison to H1 21 where Average Sales Price increased by 74%. Brooklyn led the boroughs in the Number of Sales, Total Dollar Volume, and Total Sold Buildable SF.
Development Transactions
102
Number of Sales
-21% vs Q1/2022
$1.06B
Total Dollar Volume
-28% vs Q1/2022
7.15M
Total Buildable SF
-11% vs Q1/2022
In H1 2023, 97 Foundation Approved Permits were filed with DOB – a 53% decrease from H1 2022. The total proposed ZFA decreased by 61% to 8.4 million SF. Similarly, the number of proposed dwelling units decreased by 61% to 8,492. The lapse of the 421-a tax relief program on June 15, 2022, had a significant impact on construction activity. This was evident in the drop in approved foundation permits following a surge in H1 2022 when developers scrambled to get new building permits approved and foundations in place to qualify for the program. The effects of the lapse of 421-a are still being felt today.
Permits Field in Q1/2023
97
Total No. of Permits
-53%
vs Q1/2022
8.4M
Total Proposed ZFA
-61%
vs Q1/2022
8,492
Total Proposed DU's
-61%
vs Q1/2022
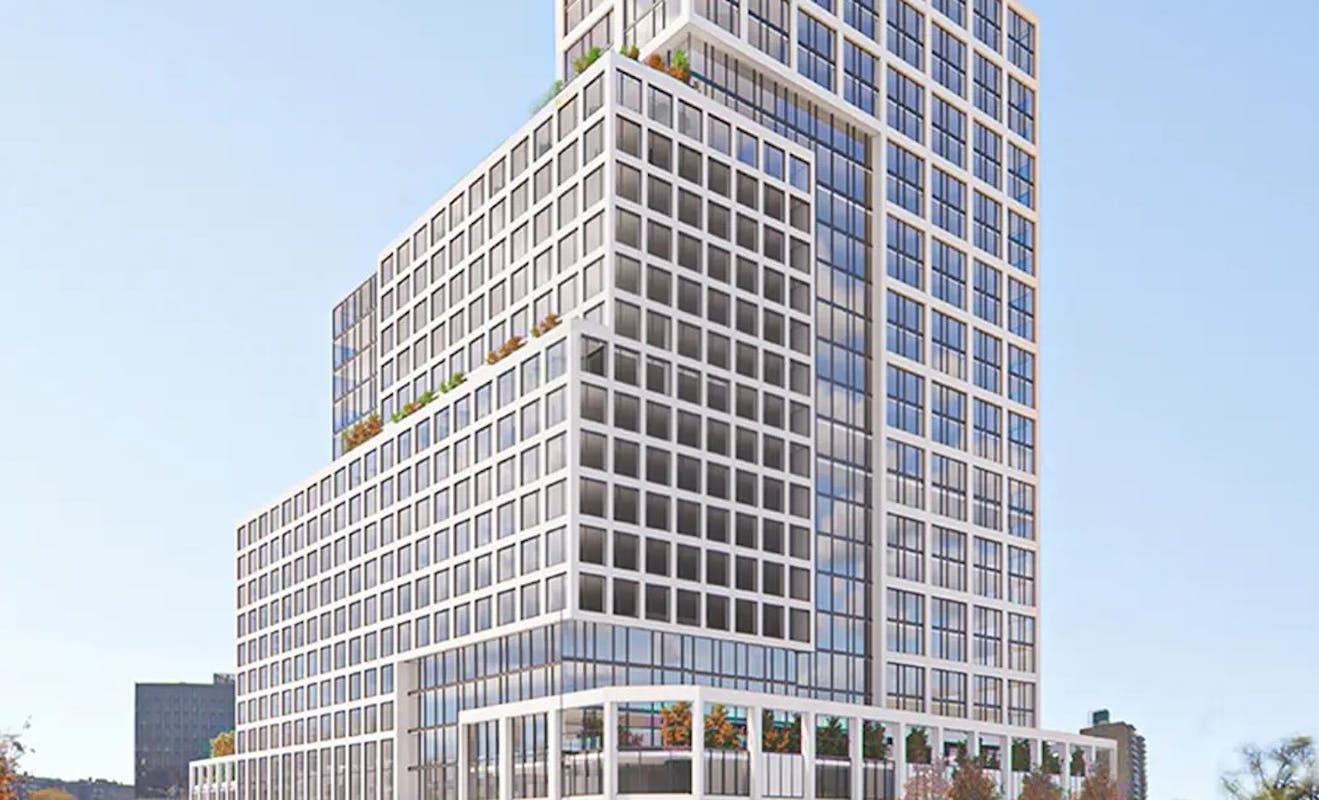
Highlighted New Buildings

267-285 Bond Street
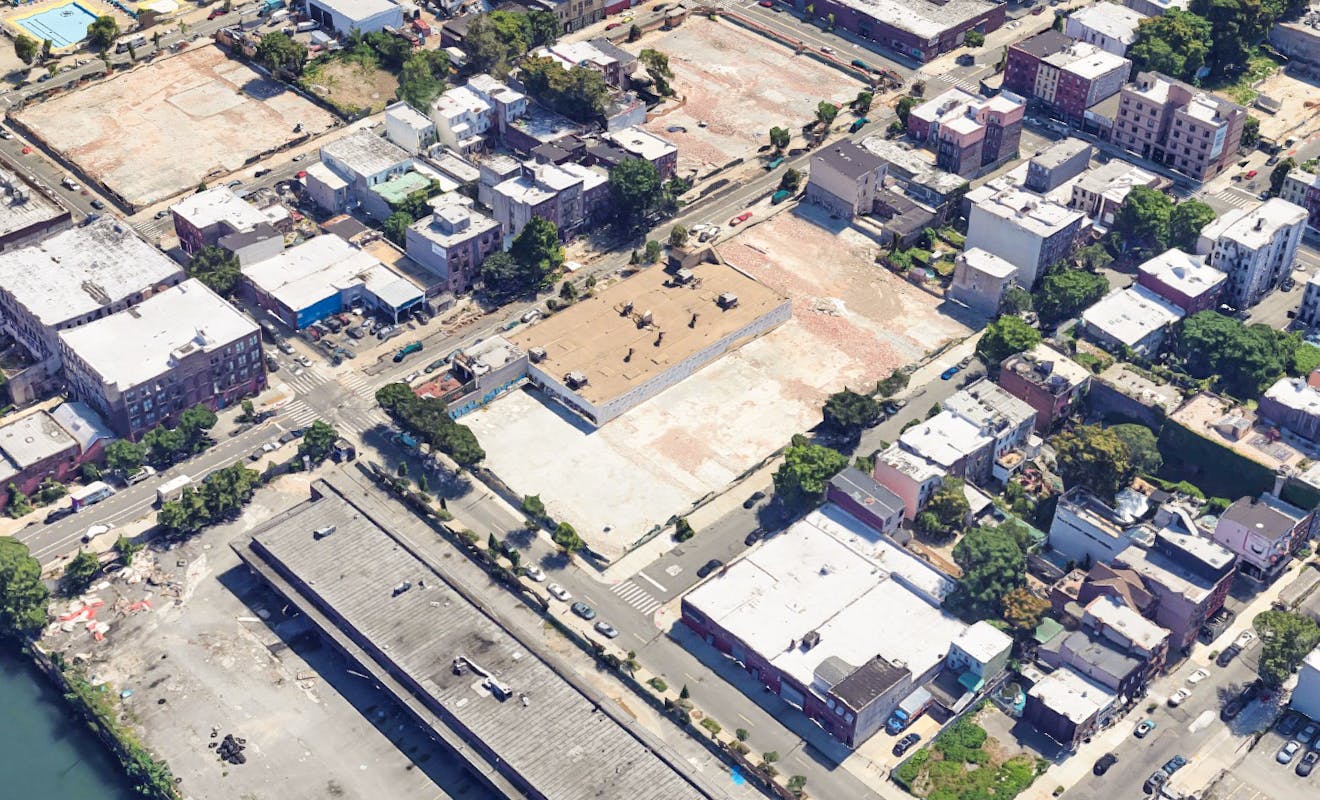
469 President St, 305 Nevins St, 514 Union St
93-30 93rd Street